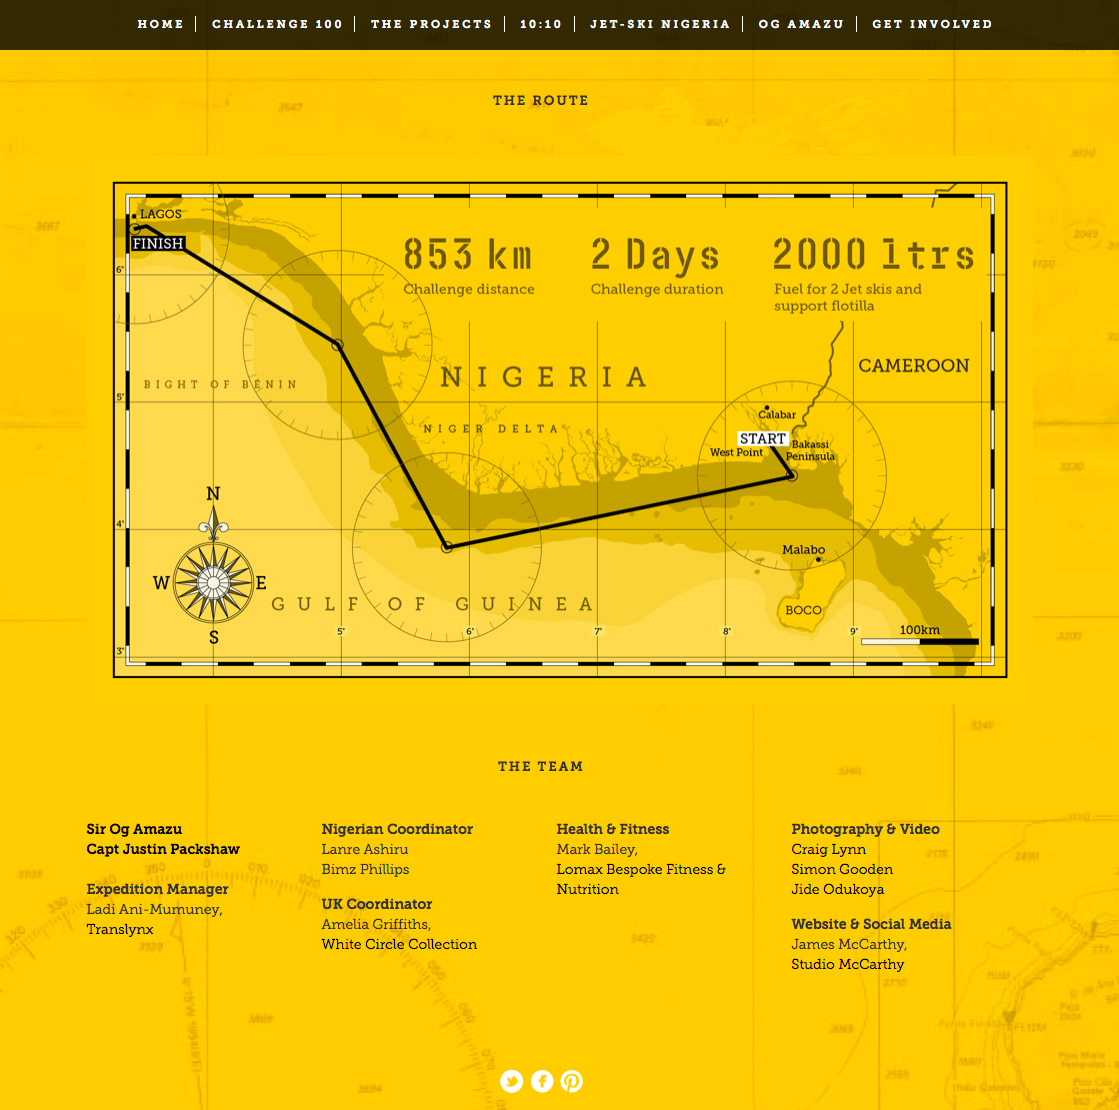
Illustrated map, infographic map, map illustration, travel map, Africa map, adventure, website map.
The illustrated maps I produce are great for showing off your location or grounds. They are especially useful for colleges, schools, universities or other learning institutions.
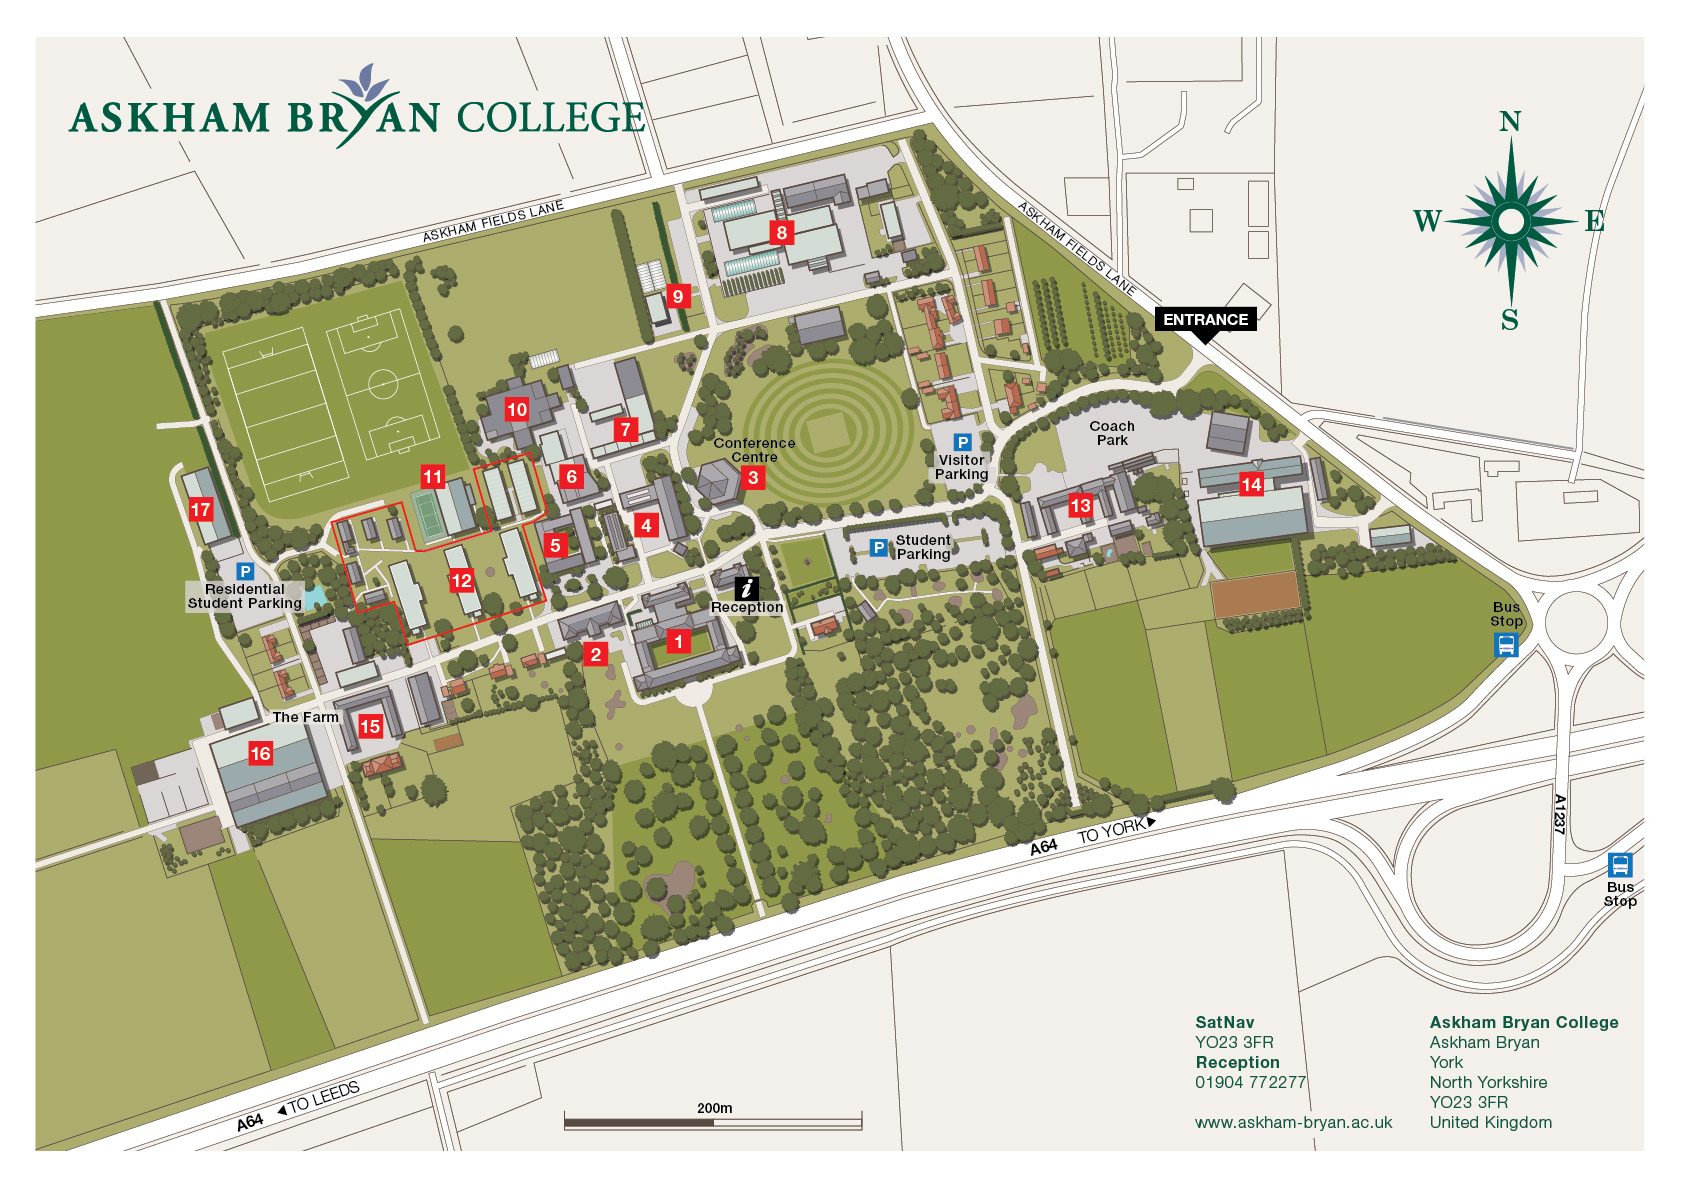
Illustrated map, campus map, university map, college map, prospectus map, map illustration, map infographic, wayfinding map, campus plan, college plan, university plan, prospectus plan.
Illustrated map, route map, creative concept map, illustration, infographic.
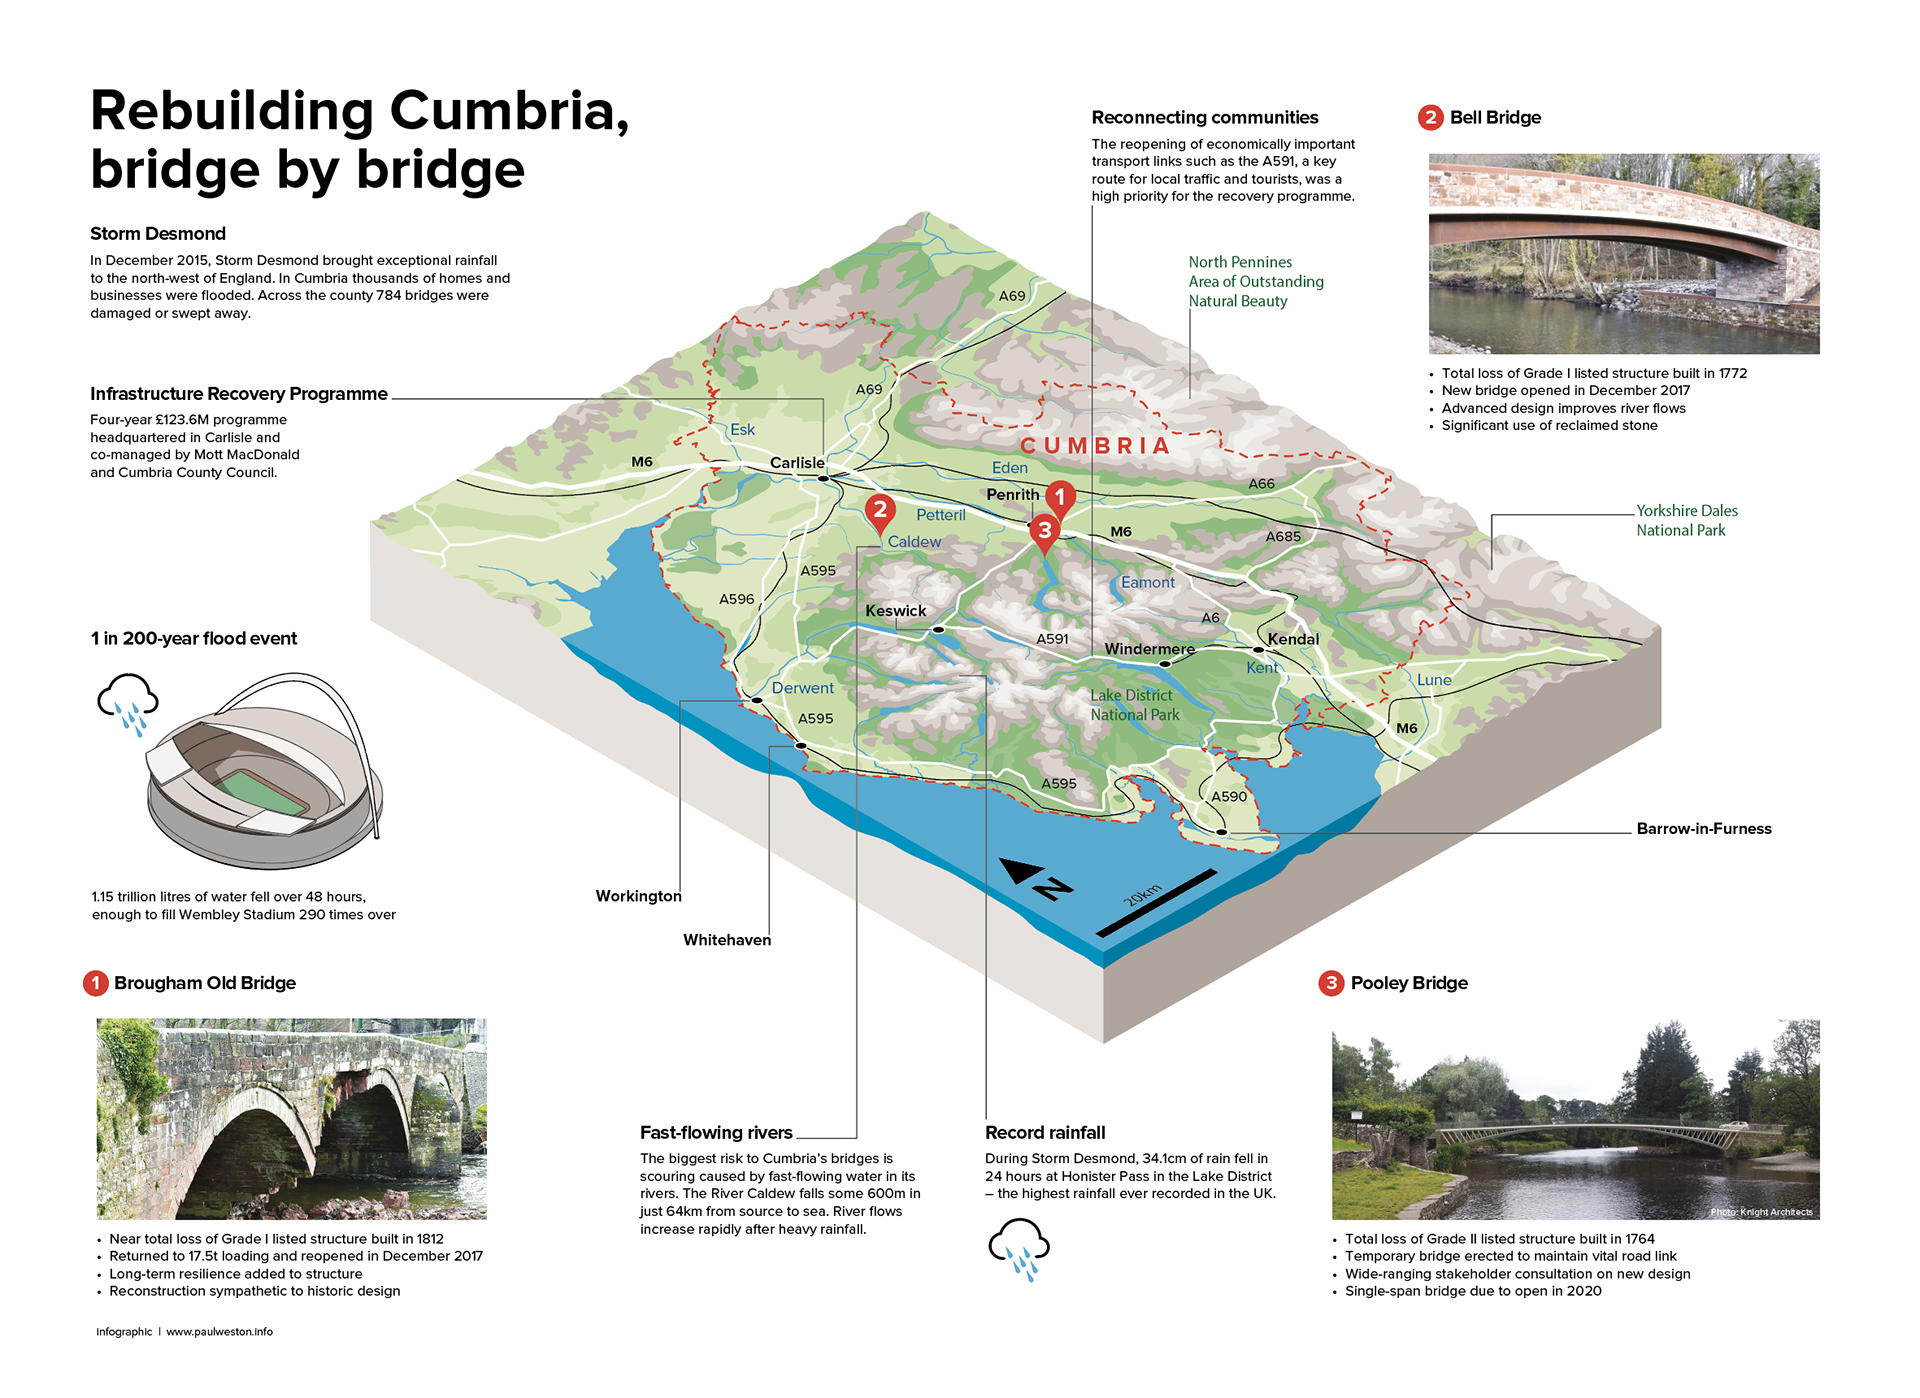
Map of Cumbria and the Lake district for marketing materials. Map artist services, Map illustrator, Map designer, Tourist map designer, Infographic services.
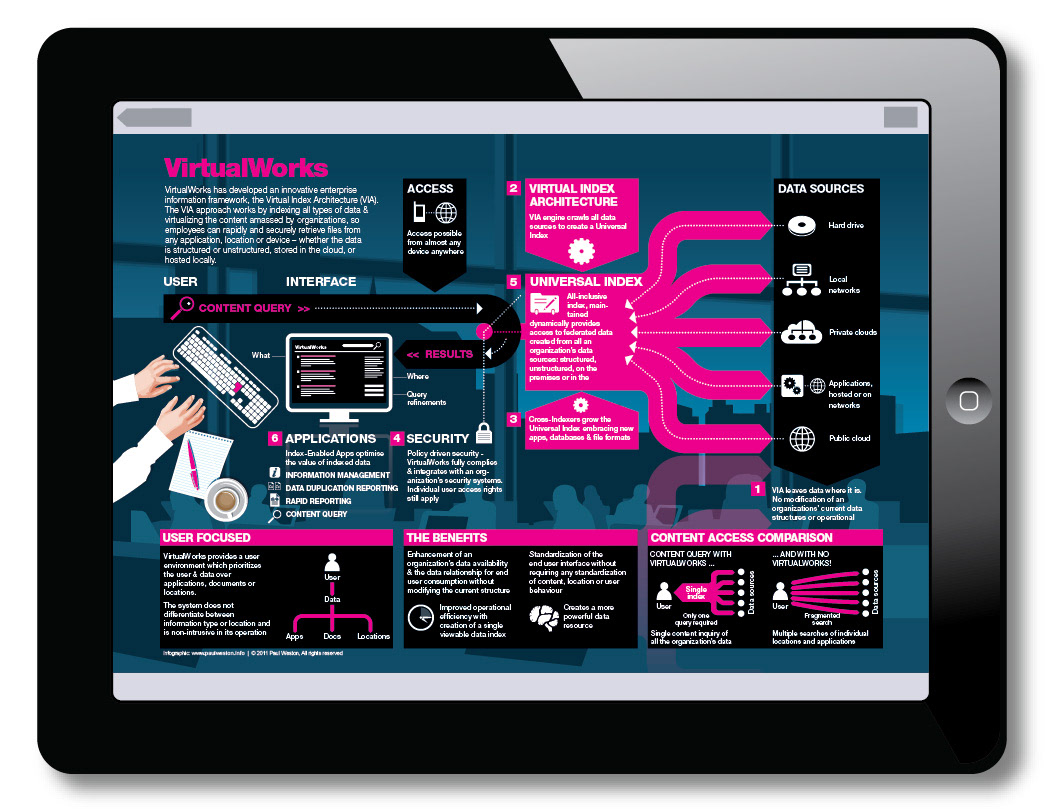
Software map, software mapping, software visualisation, infographic.
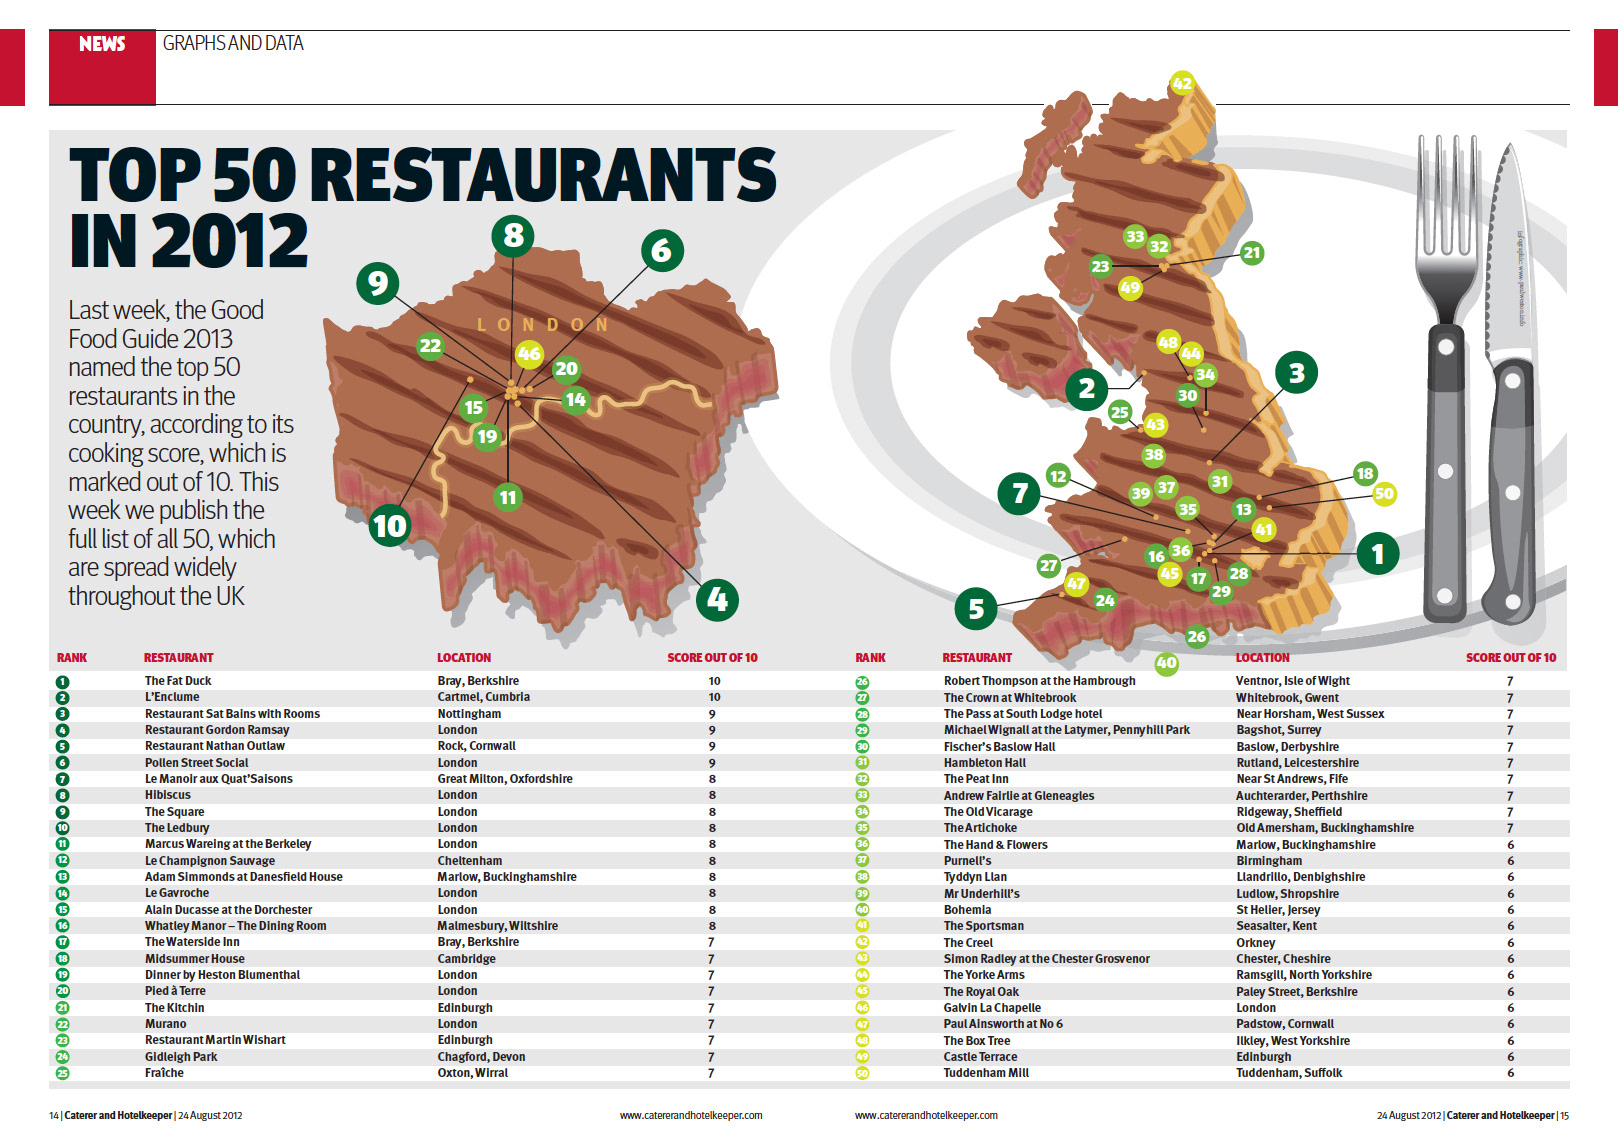
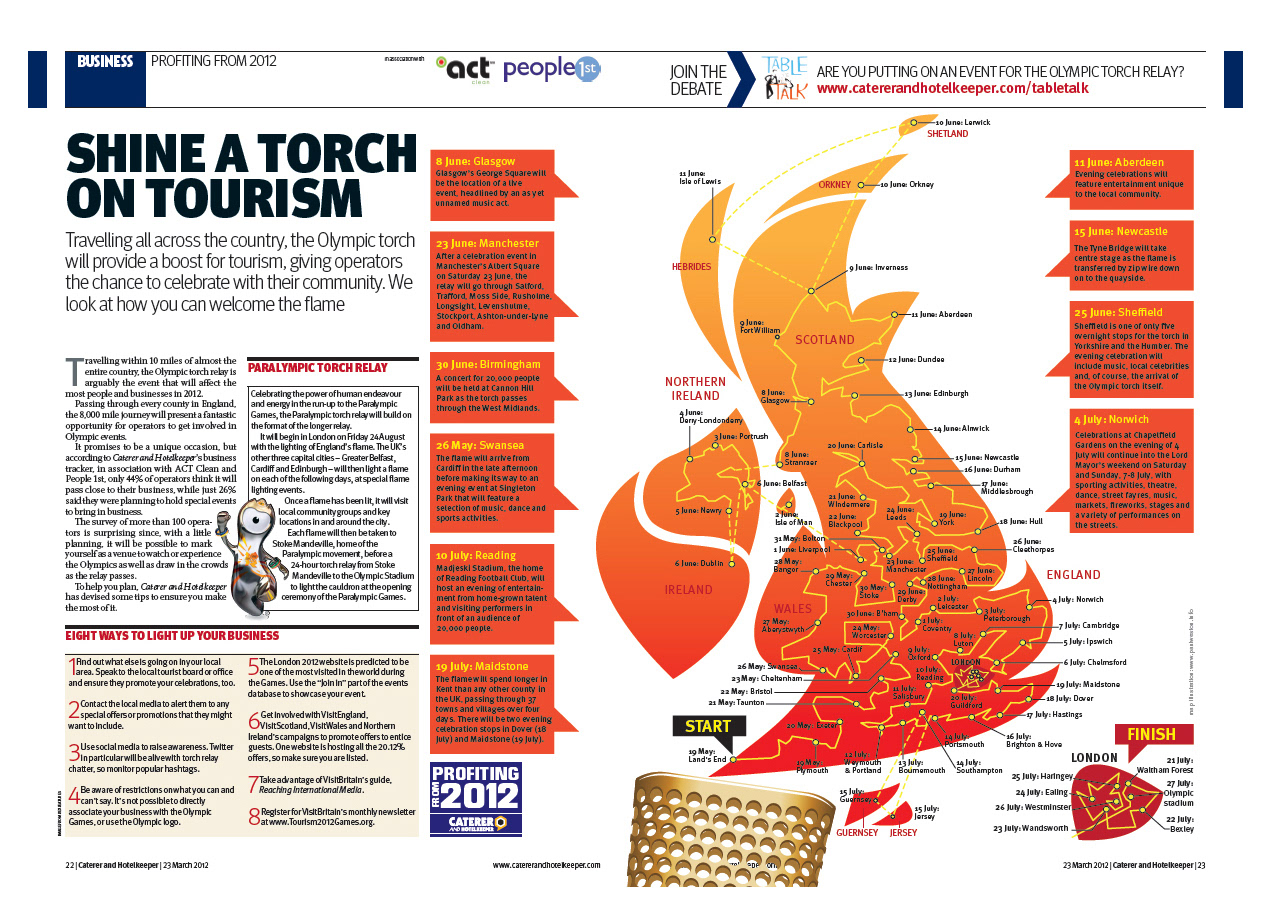
I have also created regional, national and global map illustrations to communicate specific information, such as this top 50 restaurants piece or the effects of tourism across the UK. For instance, if you have data on global warming that you want to present in a visually appealing way on a global scale to maximize its impact, I can help you achieve that. I also offer travel maps and world maps if you have data that requires visualization.
Illustrated map, creative concept map, illustration, infographic.
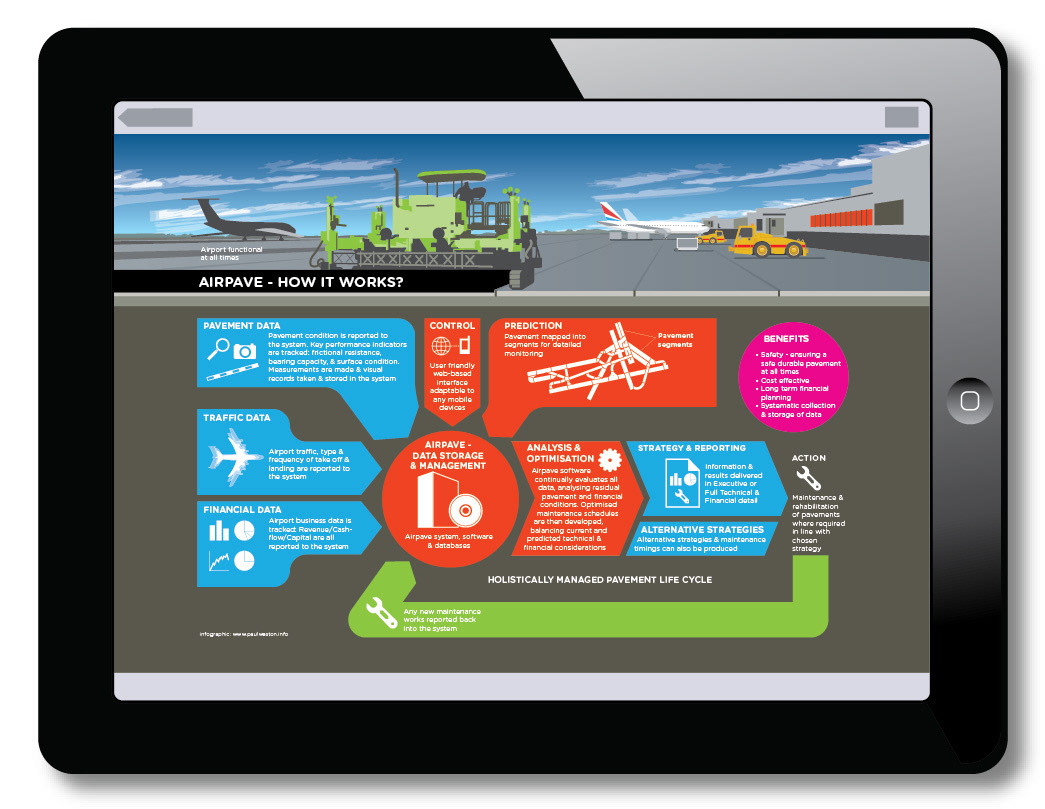
I’ve also created illustrated maps of technical information on new innovative applications and services, including Airpave - a software package that tracks and monitors lifetime cycles of airport runway paving and additional data. This complex software is displayed and broken down into it’s unique selling points and benefits to customers.
Software map, software mapping, software visualisation, infographic.
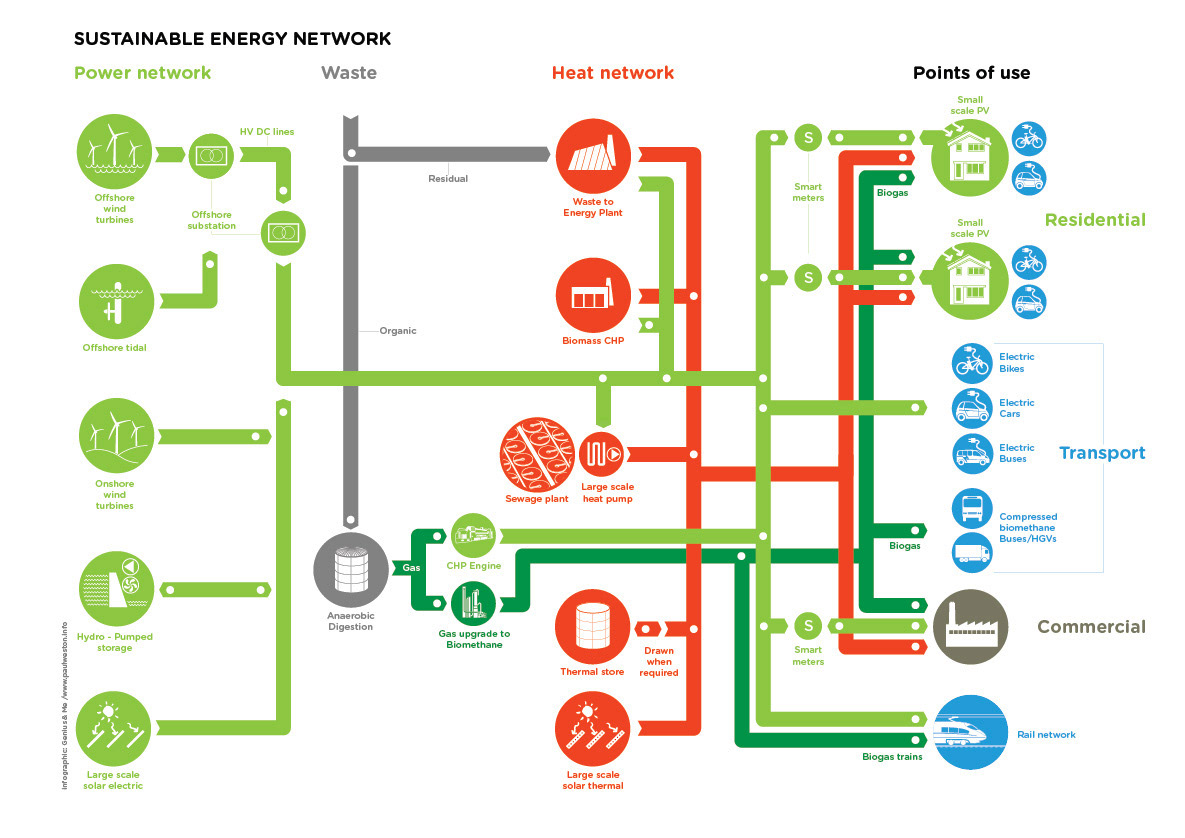
Network diagram, energy network, sustainable energy network, energy map.
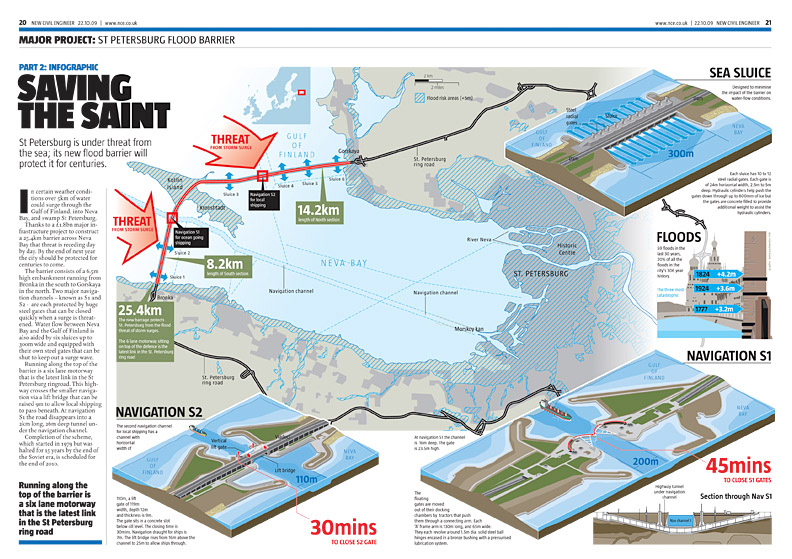
Illustrated map, technical infographic, flood protection schematic, infographic.
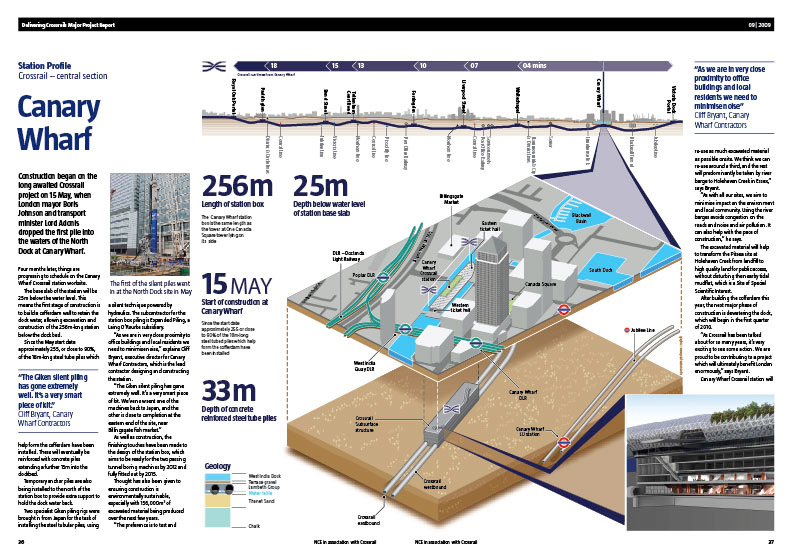
3D map, 3D city map, illustrated map, infographic.
Got a project? Give me a call or drop me a line and let’s see how we could work together.
t +44 (0)7976 642 503 | e p@ulweston.info