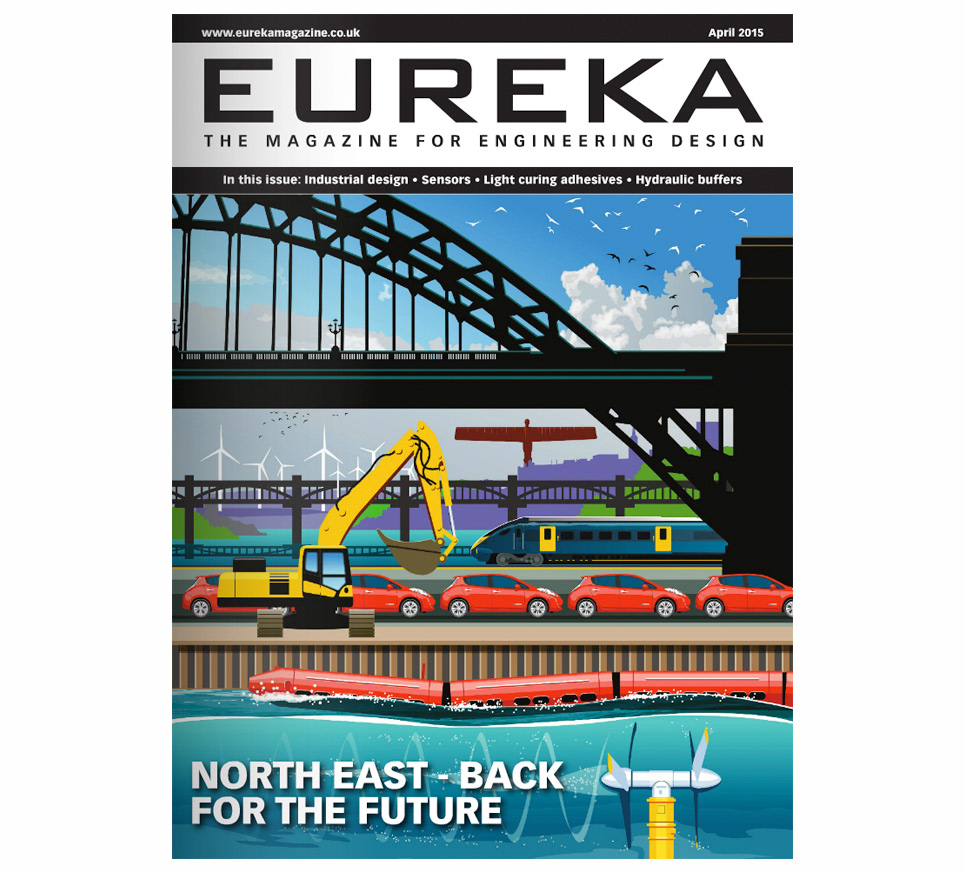
This was a cover illustration I created for an engineering design magazine, for a feature on technology and the future in the North East of England. The depiction includes water energy, construction elements, wind turbines and the recognisable Angel of the North statue.

The New Electronics magazine illustration includes a depiction of “intelligent mobility” representing a more efficient transport system using technology to enhance communications.
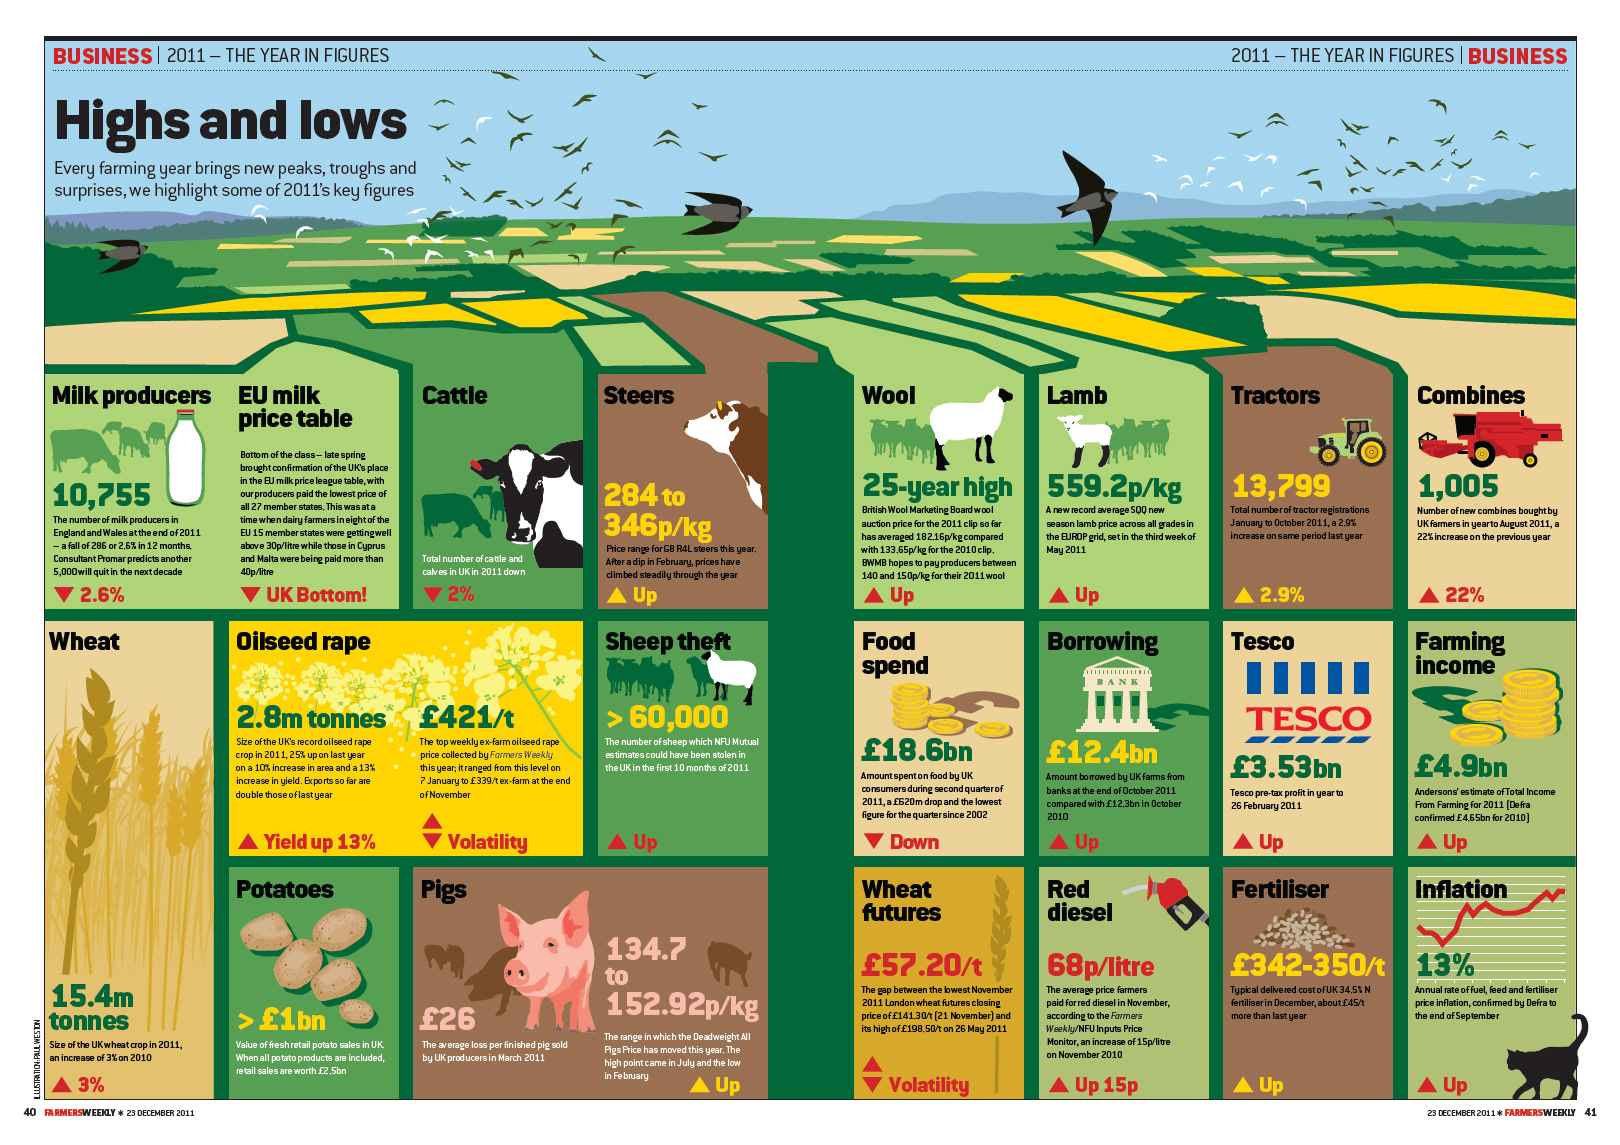
This illustration shows the key figures for 2011 in the farming industry, including details such as the number of milk producers in England, the size of wheat crops compared to 2010 and the number of cattle and calves. Mostly it shows the comparisons to the previous year.

Illustration, cover illustration, engineering, graphic illustration, transport, communications, seascape, travel.
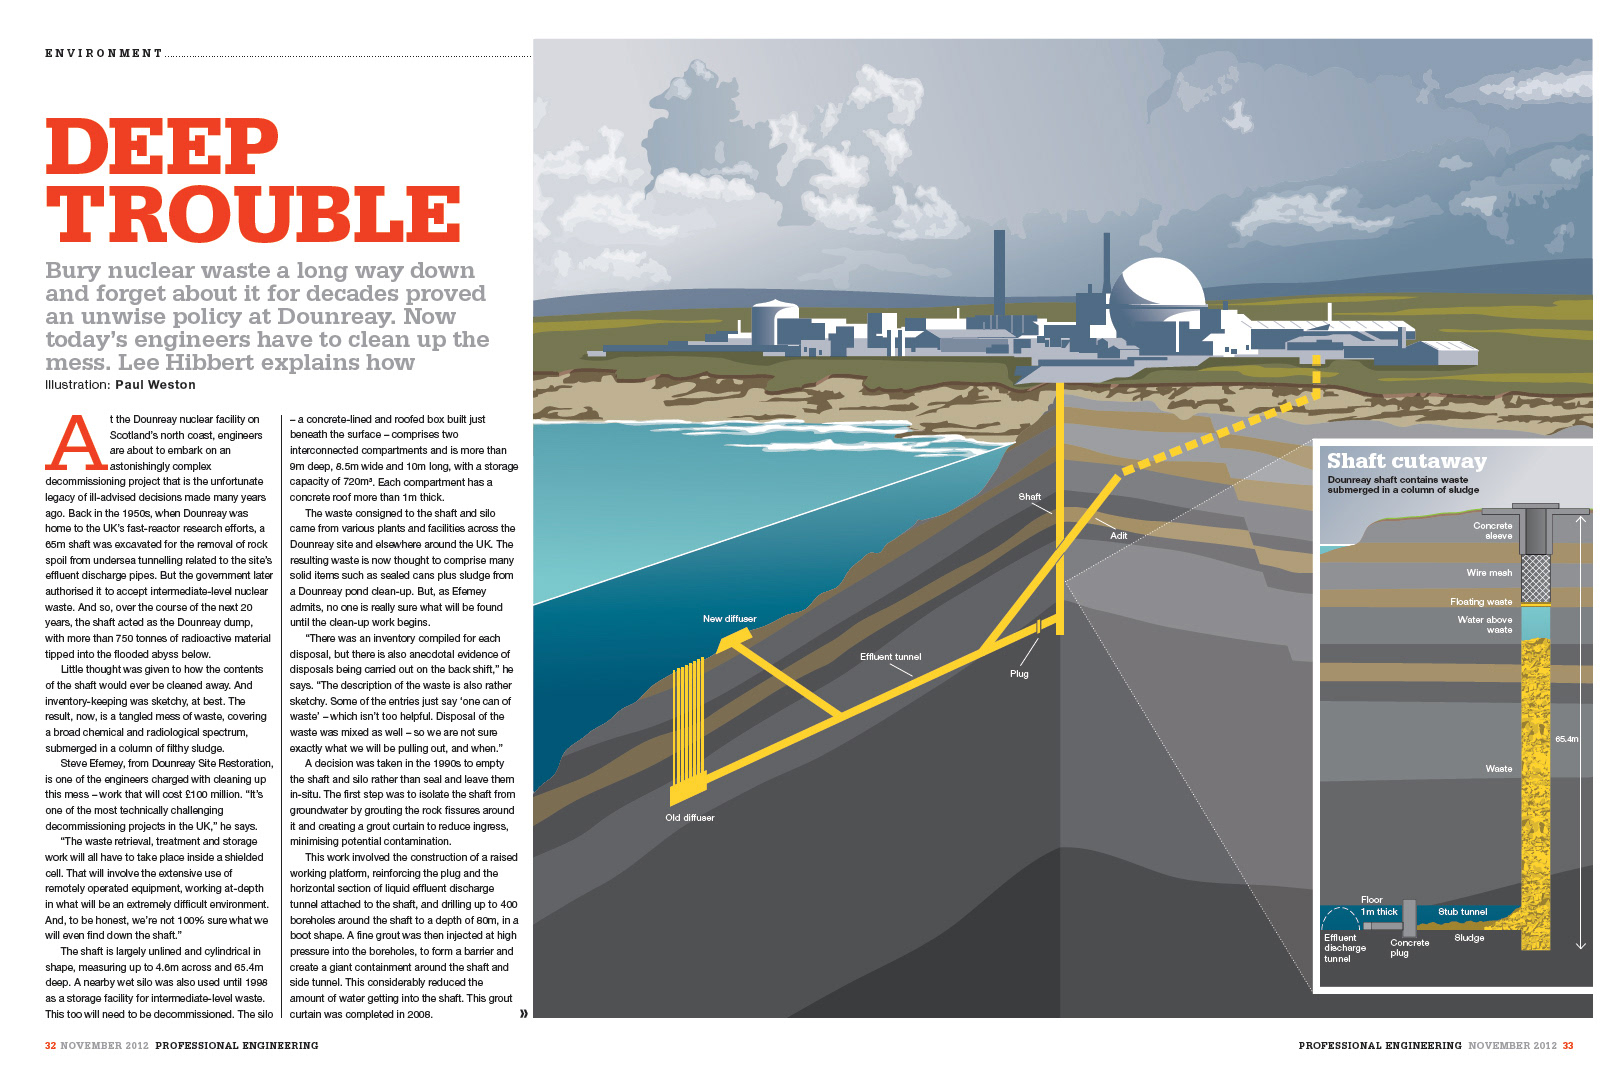
The above illustration shows details on the facility at Dounreay, where nuclear waste has been buried underground and now has to be reinforced due to the dangers of the waste and how it could affect the surrounding environment.
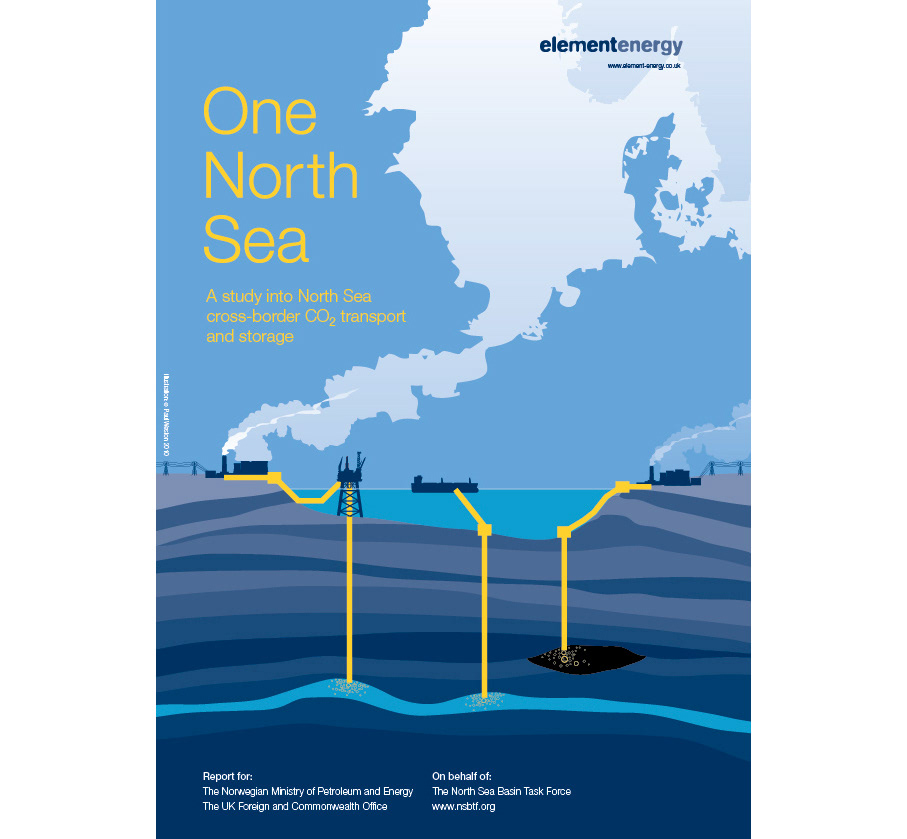
The above illustration was designed for the front cover of a study into the North Sea and the process for transporting CO2 and subsequent storage.
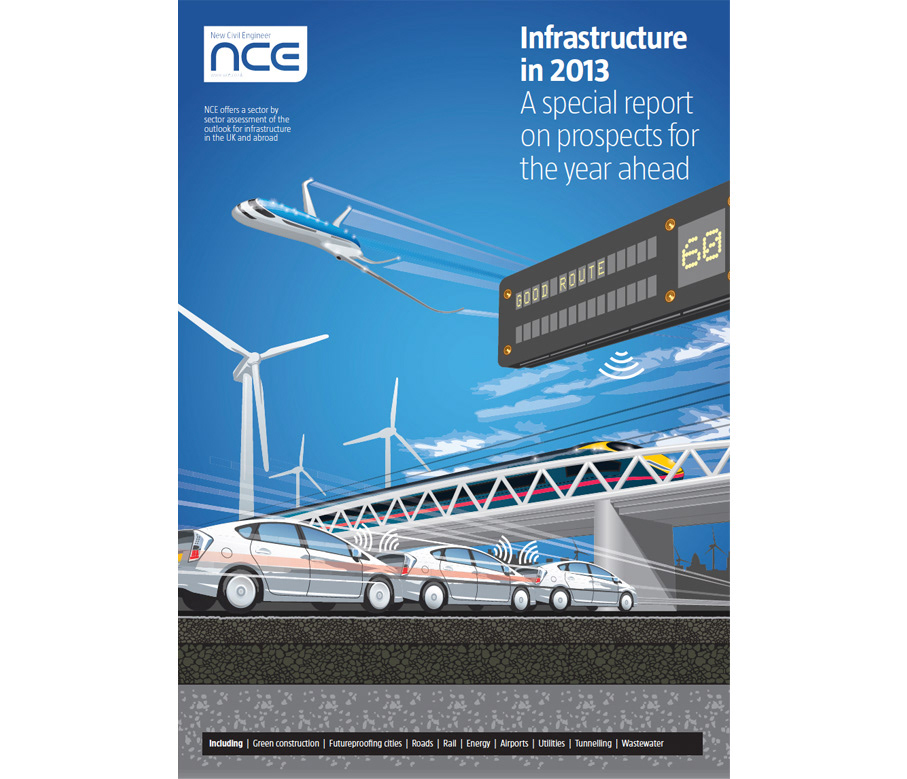
Illustration, cover illustration, engineering report, graphic illustration, transport, infrastructure.
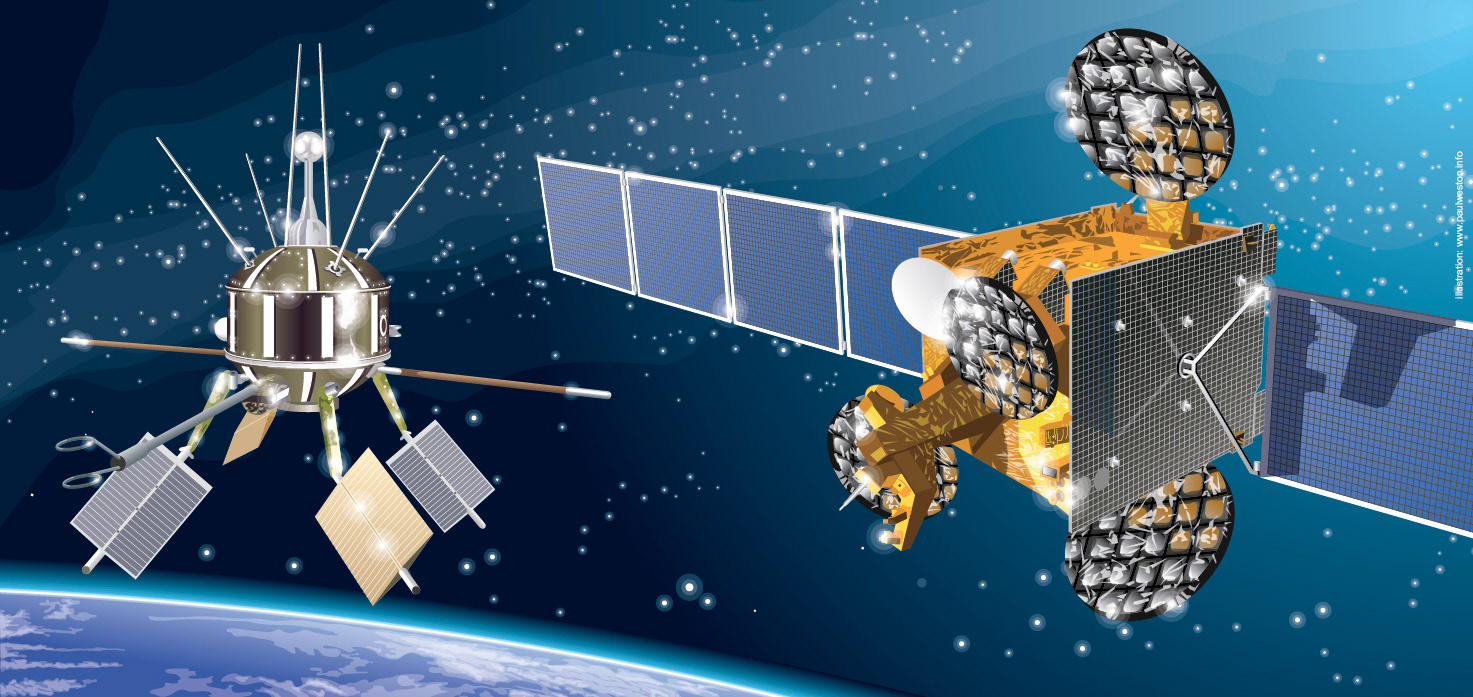
Illustration, technical illustration, space illustration, scientific, magazine publishing.
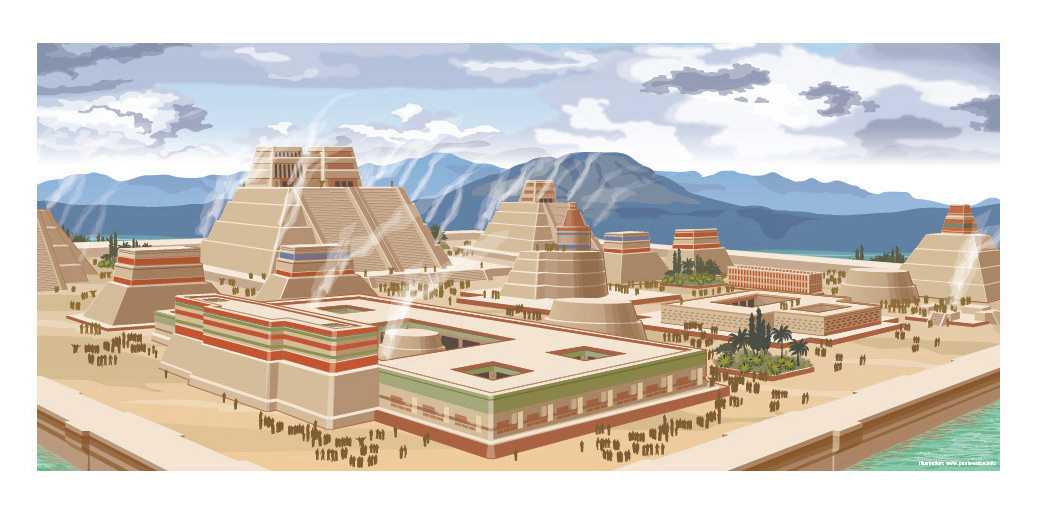
Illustration, historical reconstruction, magazine publishing, Tenotchtitlan reconstruction.
Got a project? Give me a call or drop me a line and let’s see how we could work together.
t +44 (0)7976 642 503 | e p@ulweston.info